Introduction to AWS Observability
AWS provides native monitoring, logging, alarming, and dashboards with Amazon CloudWatch, delivering the three pillars of observability (Metrics, Logs & Traces) with AI-powered insights. CloudWatch provides native OpenTelemetry support through OTLP endpoints for standardized telemetry collection.
Amazon CloudWatch Application Signals offers automatic instrumentation and complete visibility into application transactions, with pre-built dashboards, service maps, and interactive transaction search across 100% of spans.
Amazon CloudWatch Investigations provides AI-powered root cause analysis by automatically correlating metrics, logs, traces, and alarms.
Amazon CloudWatch Generative AI Observability enables monitoring of generative AI workloads with pre-configured views for latency,usage, and errors. End-to-end prompt tracing identifies issues in knowledge bases, tools, and models across frameworks like AWS Strands, LangChain, and LangGraph.
AWS also offers Amazon Managed Service for Prometheus, Amazon Managed Grafana, and Amazon OpenSearch Service for customers preferring open-source based solutions.
For application instrumentation using open standards, AWS Distro for OpenTelemetry (ADOT) provides a secure, production-ready distribution of the OpenTelemetry project. As part of the Cloud Native Computing Foundation, OpenTelemetry offers vendor-neutral APIs, libraries, and agents for collecting distributed traces and metrics. With ADOT, you can instrument your applications once and send telemetry to CloudWatch, Amazon OpenSearch Service, or any OpenTelemetry-compatible backend.
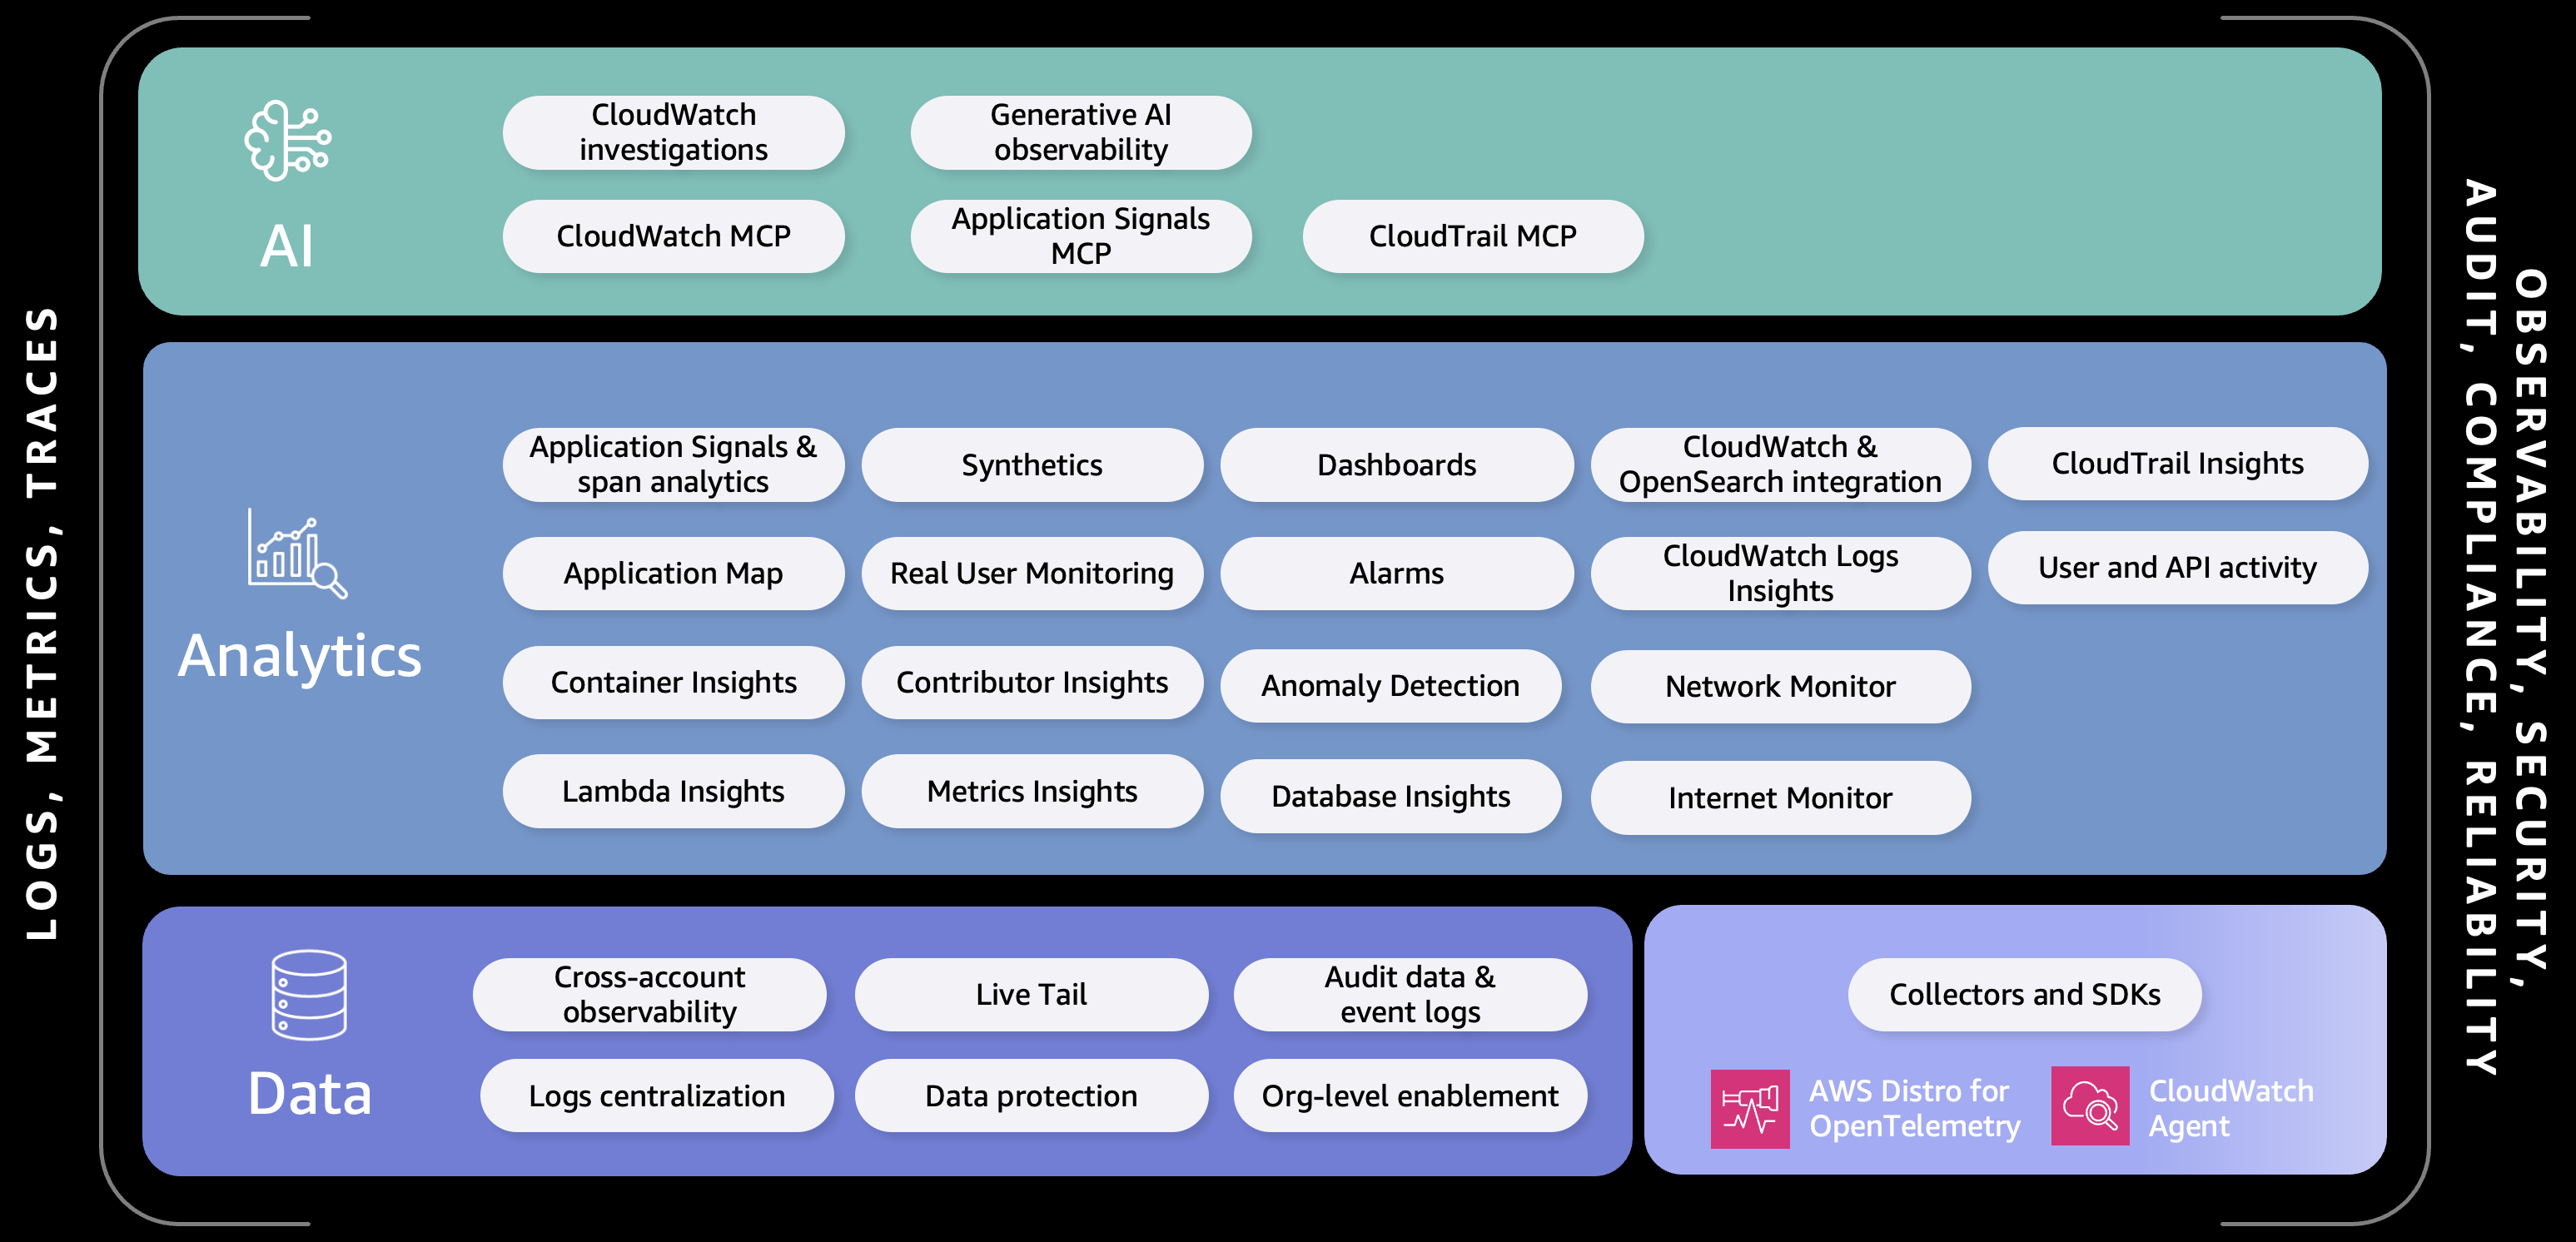
AWS Observability options