Log Management
Amazon CloudWatch Logs enables you to collect, store, and analyze log data from your AWS resources, applications, and services.
Learning objectives
In this section you will:
- Navigate the CloudWatch Logs Summary Dashboard to monitor ingestion and spot trends
- Create Standard and Infrequent Access log groups and understand when to use each
- Explore the hierarchical structure of log groups, log streams, and log events
Exploring the Log Management Summary Dashboard
The Log Management → Summary tab gives you a single-pane view of log ingestion volume, active data sources, log group counts, and recent query activity.
1) In the AWS Management Console, open CloudWatch
2) In the left navigation under Logs, click Log Management — the Summary tab is shown by default
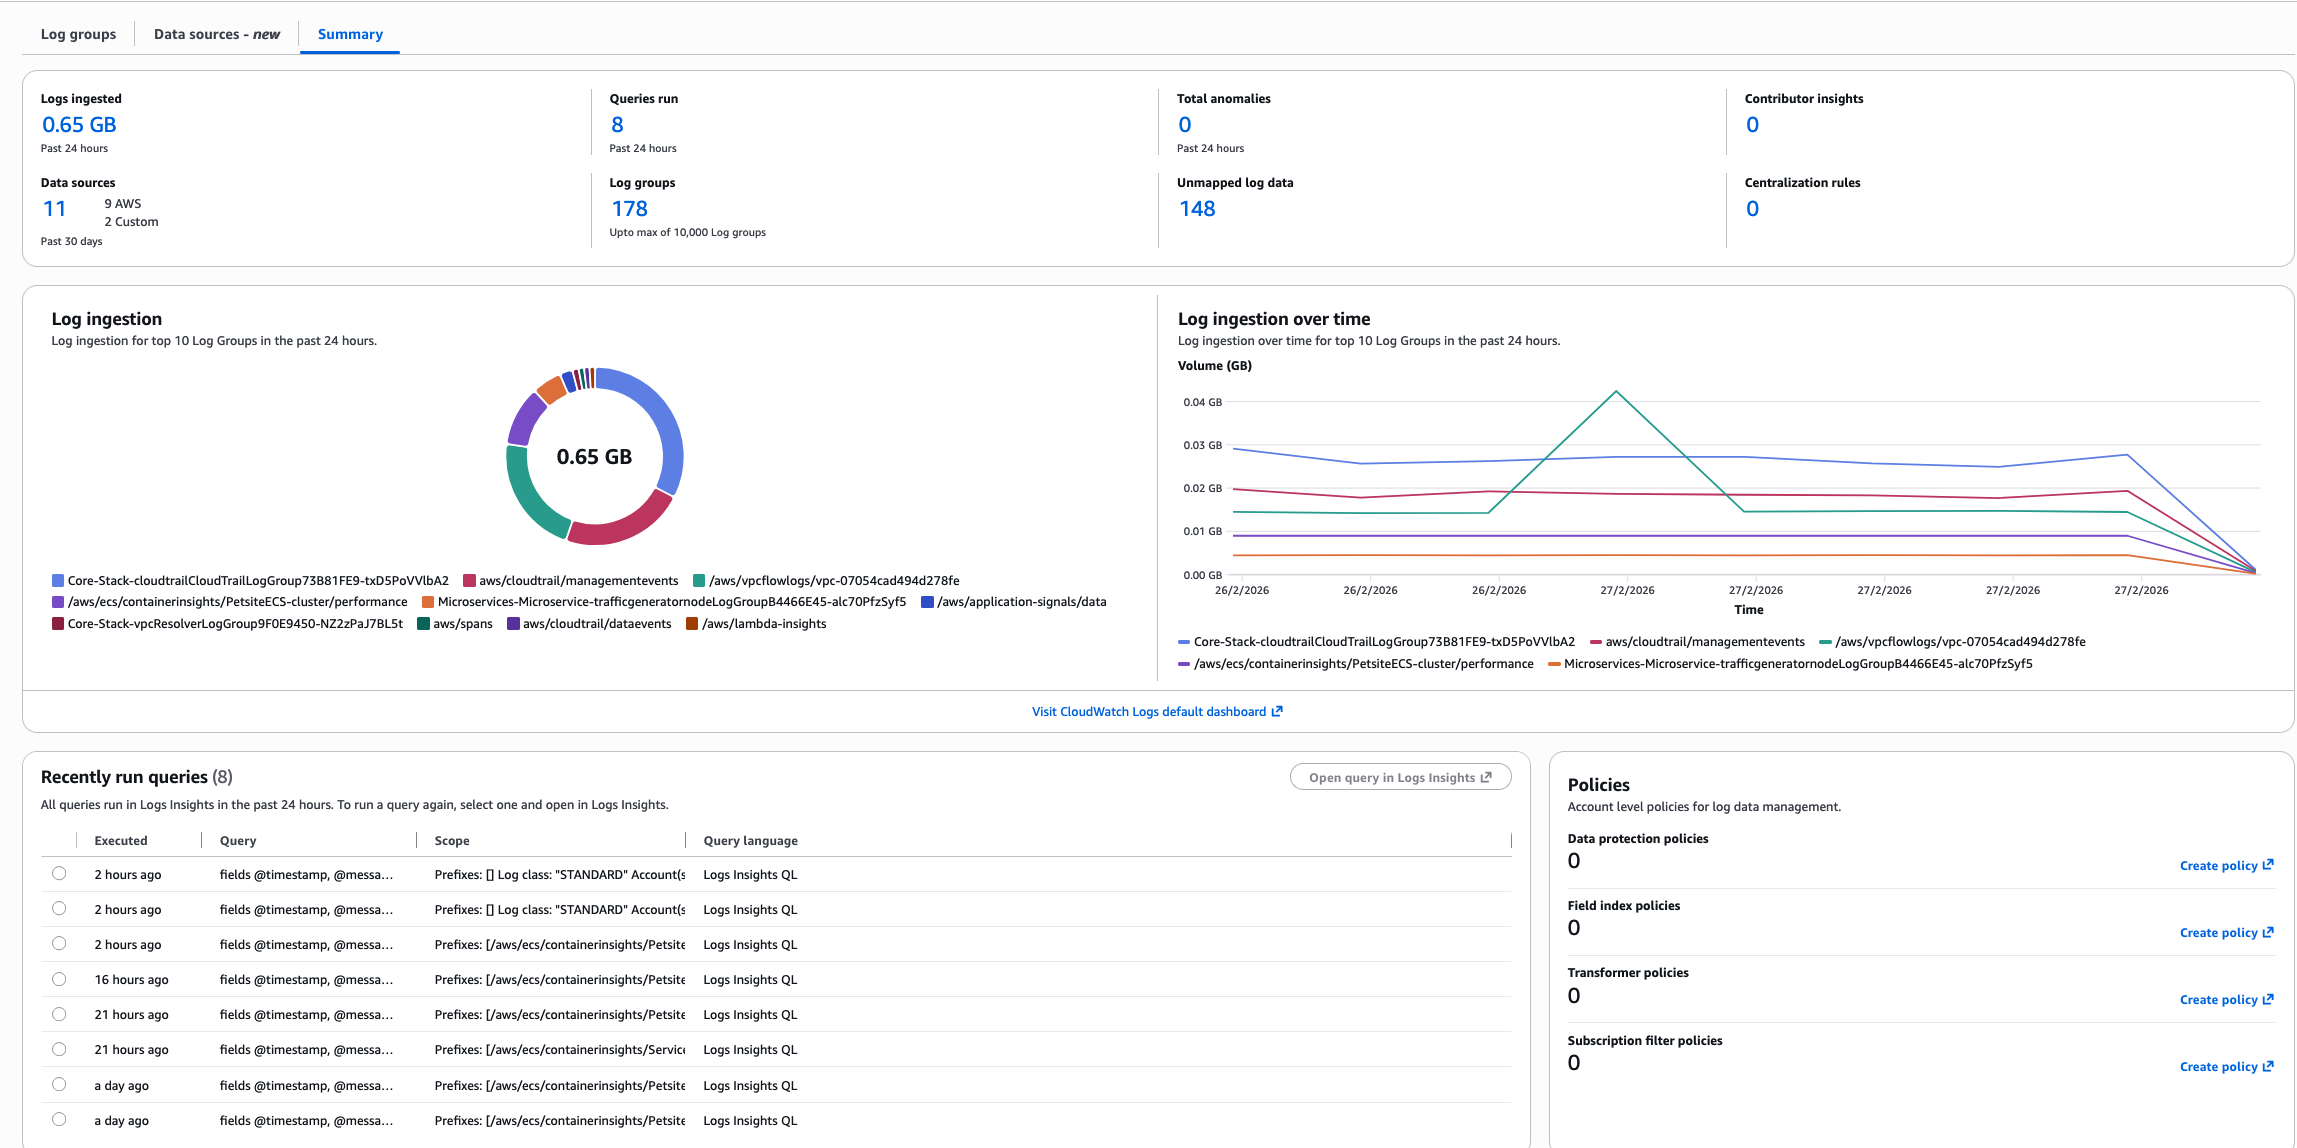
The dashboard surfaces several key metrics:
- Logs Ingested (Past 24 Hours) —> total volume received. Watch for unexpected spikes that could signal misconfigurations or runaway logging.
- Data Sources —> number of unique sources sending logs to CloudWatch. Helps you track which services and applications are actively logging.
- Log Groups —> total count of log groups in your account. Useful for assessing organization and spotting consolidation opportunities.
- Queries Run —> number of CloudWatch Logs Insights queries executed. High counts may indicate active troubleshooting or a need for automated alerting.
- Anomalies Detected —> unusual patterns flagged by CloudWatch anomaly detection. Investigate early, before users notice.
- Contributor Insights Rules —> active rules analyzing log data to identify top contributors to system behavior.
- Unmapped Log Data —> log data that hasn't been categorized yet. Worth reviewing to keep your log organization clean.
The donut chart shows which log groups consume the most ingestion capacity — useful for identifying candidates to move to Infrequent Access. The line graph shows 24-hour ingestion trends so you can spot spikes or unexpected quiet periods.
Best Practice: Review this dashboard regularly to establish baseline patterns. Once you know what "normal" looks like, anomalies and cost changes are much easier to catch.