Ingestion - Telemetry pipelines
CloudWatch pipelines provide a centralized way to collect data from AWS services, third-party applications, and custom sources, process and transform data using a rich set of processors, convert data into standard formats like Open Cybersecurity Schema Framework (OCSF), and route processed data to destinations like CloudWatch Logs.
Key capabilities
- Multiple data sources: Ingest data from CloudWatch Logs, S3 buckets, and third-party services
- Rich processing: Transform, parse, and enrich log data
- Format standardization: Convert varied log formats into OCSF for unified security analysis
- Secure data handling: All data remains encrypted in transit with TLS
- Monitoring and observability: Track pipeline health and performance with CloudWatch metrics
WARNING: CloudWatch pipeline capabilities are offered as part of existing CloudWatch Logs Data ingestion pricing at no additional cost, with metering occurring at time of ingestion.
For more information, refer to CloudWatch Pipelines
Understanding pipeline components
Each pipeline consists of three main components:
| Component | Description |
|---|---|
| Source | Defines where your data comes from (AWS services, third-party applications, or custom sources) |
| Processors (Optional) | Transform, parse, and enrich log data as it flows through the pipeline |
| Sink | Specifies where your processed data should be delivered |
Sink behavior
| Source Type | Destination |
|---|---|
| CloudWatch Logs sources | Events are sent back to their original log group using @original |
| S3 and third-party sources | Events are sent to a specified log group |
Setup pipeline for CloudTrail logs
In this section, you will create a pipeline that intercepts CloudTrail logs from CloudWatch Logs, transforms them into OCSF format, and sends them back to the original log group. This standardization enables unified security analysis across different log sources.
Prerequisites
Ensure you have CloudTrail logs enabled and sending to CloudWatch Logs. If you completed the Enablement Rules module, you should already have CloudTrail configured with log groups like aws/cloudtrail/managementevents or aws/cloudtrail/dataevents.
Create pipeline
1) Go to the CloudWatch Console.
2) In the navigation pane, choose Ingestion and select Pipelines.
3) Click Create pipeline with the following details:
| Step | Configuration |
|---|---|
| Data source | Select AWS CloudTrail logs from drop-down |
| Pipeline name | Enter demo-pipeline-cloudtrail, click Next |
| Configuration details | Select Management in Log source type drop-down |
| Service access | Choose Auto create and use a new service role, click Next |
| Configure destination | Leave default, click Next |
| Configure processors | Choose OCSF processor from drop-down, click Add |
| OCSF versions | Select latest versions for both OCSF schema and Mapping version, click Next |
4) Review the details and click Create pipeline.
The pipeline will start processing logs within a few minutes. New CloudTrail management events flowing into the aws/cloudtrail/managementevents log group will be automatically intercepted, transformed into OCSF format, and written back to the original log group. Pipeline creation takes up to 5 minutes depending on the source type.
Manage pipelines
After creating pipelines, you can monitor their performance and manage their configuration through the Pipelines tab.
Check pipeline status
1) Go to the CloudWatch Console.
2) In the navigation pane, choose Ingestion and select Pipelines.
3) Locate the pipeline demo-pipeline-cloudtrail.
4) Verify the Processing status and Data throughput metrics.
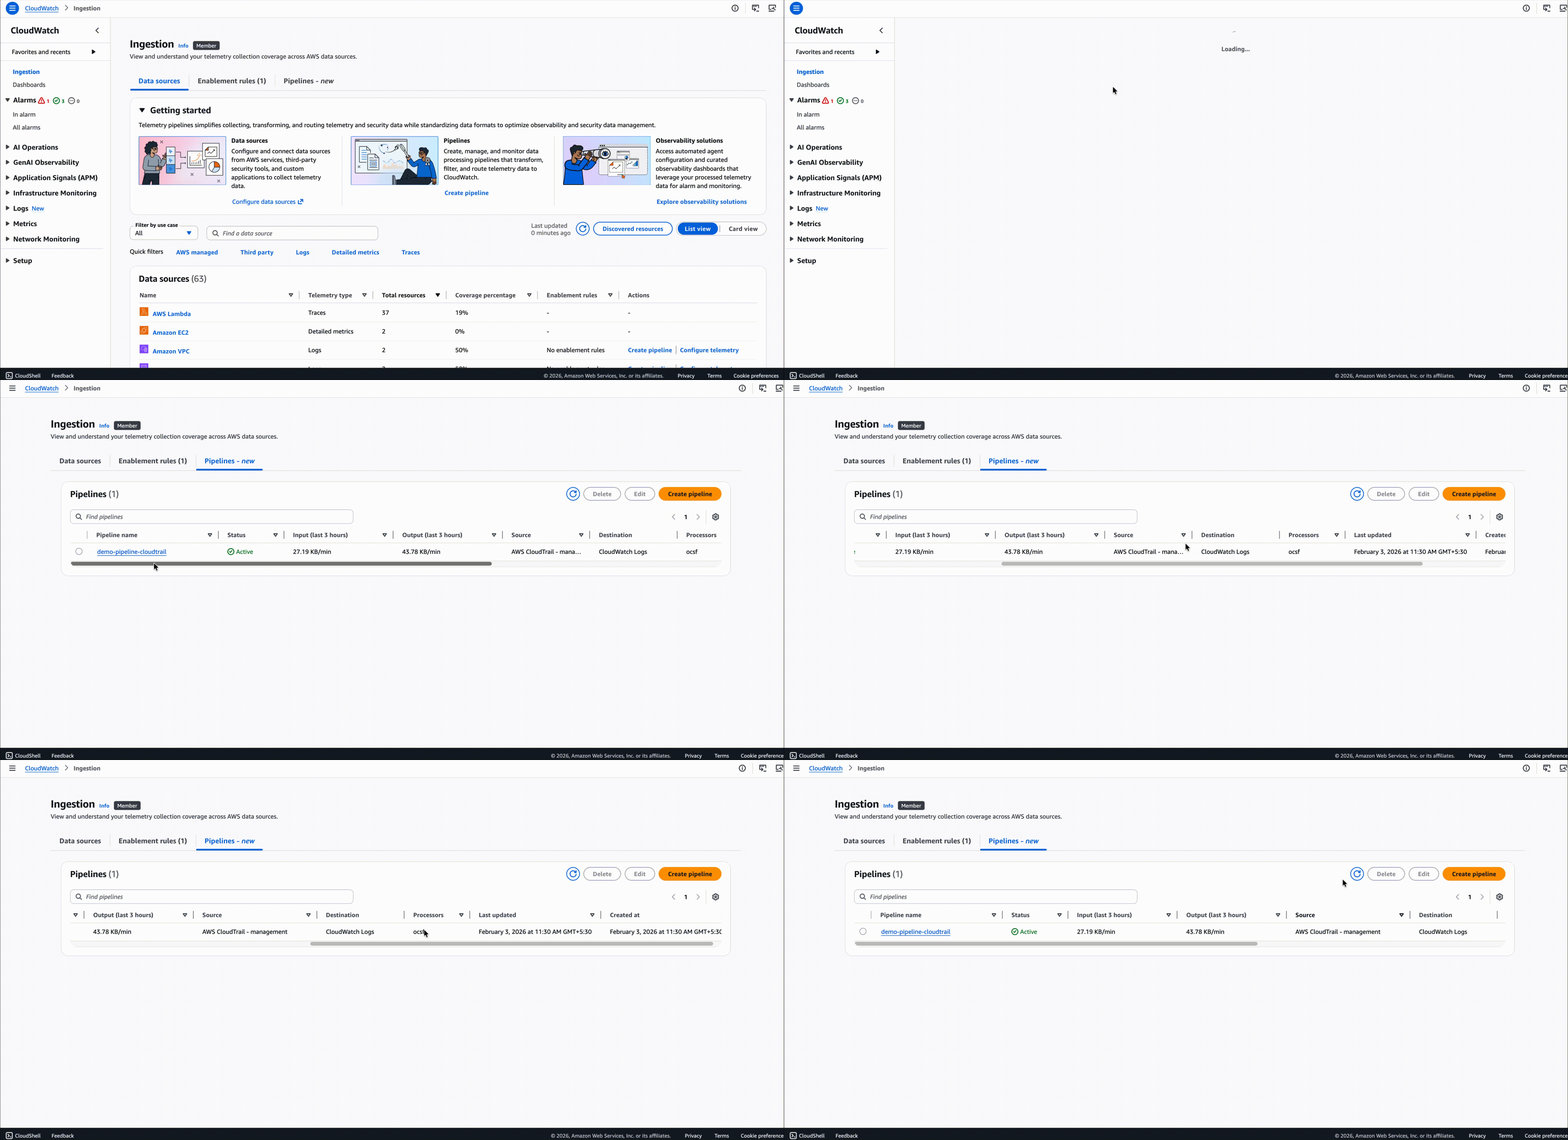
Review pipeline details
Review comprehensive pipeline details including general settings, visualization, metrics, and configuration.
1) Go to the CloudWatch Console.
2) In the navigation pane, choose Ingestion and select Pipelines.
3) Click on the pipeline demo-pipeline-cloudtrail.
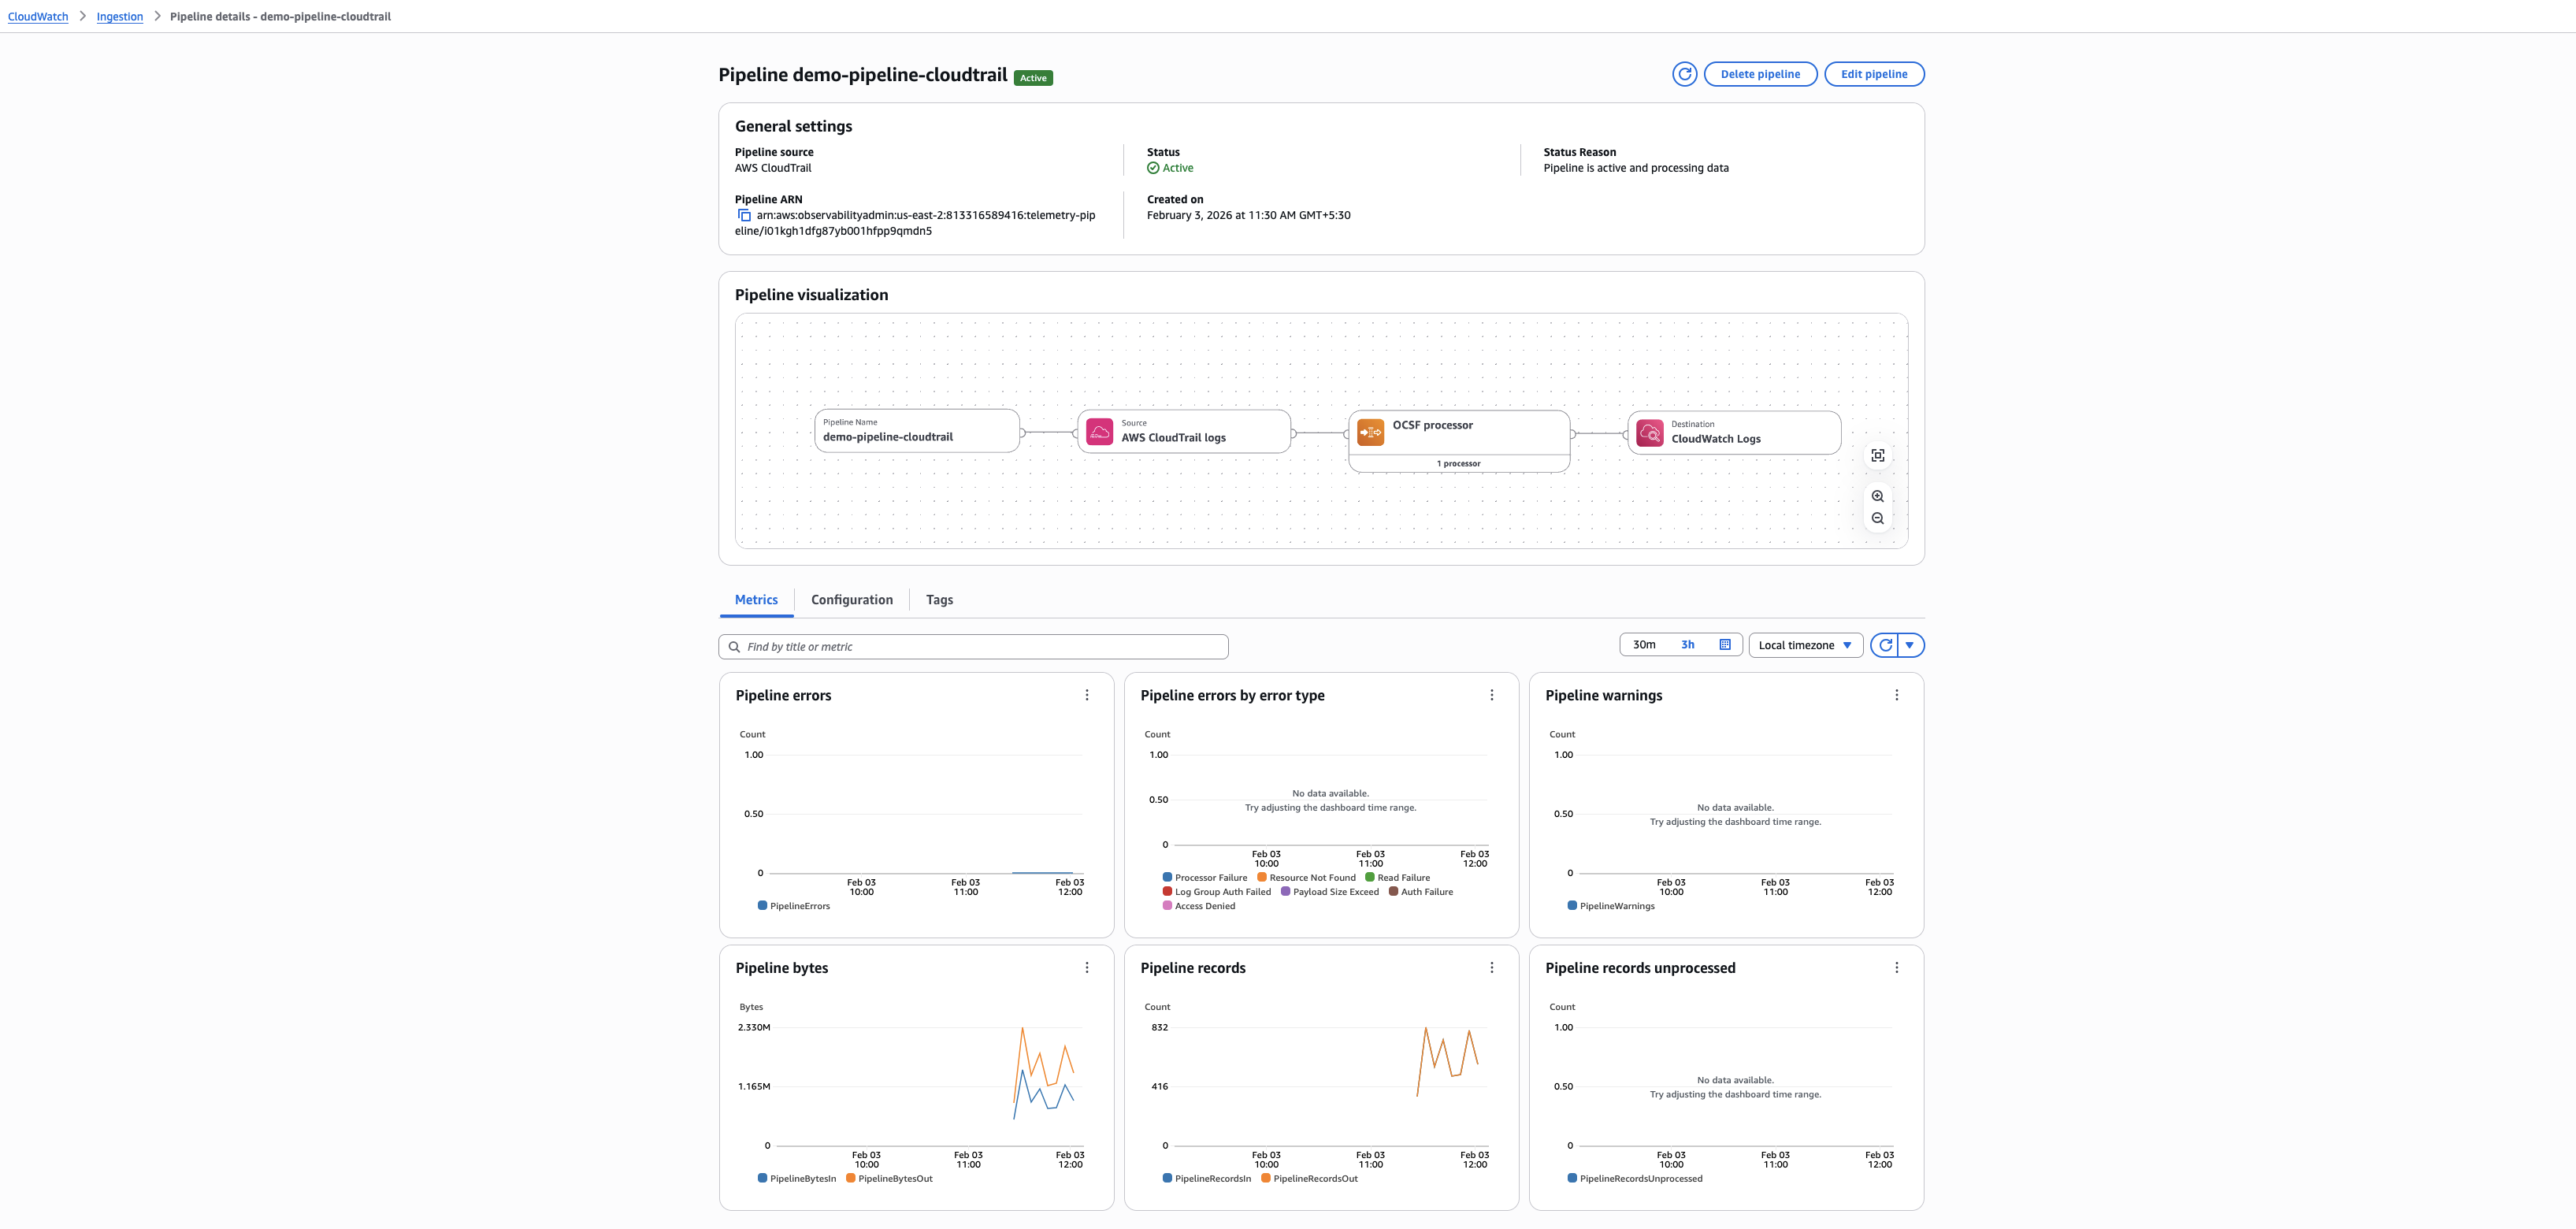
The pipeline details page displays the following information:
| Tab | Description |
|---|---|
| General Settings | View key pipeline information including pipeline name, status, status reason, creation date |
| Visualization | Shows the data flow through your pipeline from source to destination |
| Metrics | Displays pipeline performance data to monitor health, performance, and data flow patterns |
| Configuration | Shows your pipeline definition in YAML or JSON format |
| Tags | View and manage tags associated with your pipeline for resource organization |
Inspect transformed logs
Based on the configuration above, the pipeline is now actively processing CloudTrail logs and transforming them into OCSF format. With the pipeline metrics showing active data flow, you can now inspect the transformed logs in the destination log group.
View transformed logs
1) Go to the CloudWatch Console.
2) In the navigation pane, choose Logs → Log Management.
3) Filter and open the log group aws/cloudtrail/managementevents.
4) Click Search all log streams.
5) Adjust the time range to display recent events (e.g., last 5, 10, or 15 minutes).
6) Examine the log events: - For OCSF-transformed logs, you should see structured JSON with OCSF fields - Look for fields like class_name, category_name, severity, time, api, actor, etc.
Example OCSF-transformed CloudTrail log
{
    "resources": [
        {
            "uid": "arn:aws:ssm:us-east-2:123456789012:parameter/petstore/petsiteurl",
            "owner": {
                "account": {
                    "uid": "123456789012"
                }
            }
        }
    ],
    "time": 1640000000000,
    "time_dt": "2021-12-20 13:33:20.000000Z",
    "class_name": "API Activity",
    "class_uid": 6003,
    "category_name": "Application Activity",
    "category_uid": 6,
    "cloud": {
        "provider": "AWS",
        "region": "us-east-2",
        "account": {
            "uid": "123456789012"
        }
    },
    "severity_id": 1,
    "severity": "Informational",
    "api": {
        "request": {
            "data": "{\"name\":\"/petstore/petsiteurl\",\"withDecryption\":false}",
            "uid": "11111111-2222-3333-4444-555555555555"
        },
        "operation": "GetParameter",
        "service": {
            "name": "ssm.amazonaws.com"
        }
    },
    "actor": {
        "user": {
            "type": "AssumedRole",
            "uid": "arn:aws:sts::123456789012:assumed-role/ExampleRole/session-name"
        }
    },
    "status": "Success",
    "activity_name": "Read",
    "type_name": "API Activity: Read"
}
The original CloudTrail JSON format uses AWS-specific field names like eventName, userIdentity, and awsRegion. After OCSF transformation, these are mapped to standardized fields such as api.operation, actor.user, and cloud.region, enabling unified security analysis across different log sources and vendors.
Monitor pipeline health
CloudWatch pipelines publish metrics to Amazon CloudWatch in the AWS/Observability Admin namespace. Use these metrics to monitor your pipelines' health, performance, and data flow.
View pipeline metrics
1) Go to the CloudWatch Console.
2) In the navigation pane, choose Metrics → All metrics.
3) Select the Observability Admin namespace under AWS namespaces.
4) Choose PipelineName dimension and select the pipeline demo-pipeline-cloudtrail.
5) View available metrics.
For more information, see Monitoring Pipelines Using CloudWatch Metrics.
Create alarms
You can create CloudWatch alarms based on any of the pipeline metrics. For example, create an alarm that monitors PipelineErrors and PipelineWarnings to detect and identify potential issues with the pipeline configuration.
For more information, see Create a CloudWatch alarm based on a static threshold
Delete a pipeline
1) Go to the CloudWatch Console.
2) In the navigation pane, choose Ingestion and select Pipelines.
3) Click on the pipeline demo-pipeline-cloudtrail.
4) Click Delete and confirm deletion.
WARNING: Deleting a pipeline does not delete the logs that were already processed. It only stops future log processing.
Best practices
| Practice | Recommendation |
|---|---|
| Monitor Data Flow | Track PipelineBytesIn, PipelineBytesOut, PipelineRecordsIn, and PipelineRecordsOut metrics. Watch for unexpected changes in throughput patterns. |
| Track Errors and Warnings | Create alarms for PipelineErrors to detect issues quickly. Use PipelineErrorsByErrorType to diagnose specific problems. Monitor PipelineWarnings to catch potential issues early. |
| Configure Appropriate Thresholds | Set alarm thresholds based on expected data patterns. Account for normal variations and peak usage periods to avoid false positives. |
| Pipeline Design | Start simple and add complexity as needed. Test processors with sample data before deploying. Use only necessary processors to minimize latency. |
Summary
In this module, you learned how to use CloudWatch Pipelines to collect, transform, and route log data. You created a pipeline for CloudTrail logs, configured processors to transform data into OCSF format, monitored pipeline health using CloudWatch metrics, and reviewed transformed logs.